Common Data
The Brother Group Global Charter
| FY2020 | FY2021 | FY2022 | FY2023 | FY2024 | |
|---|---|---|---|---|---|
| The Brother Group Global Charter | Established in 1999 | ||||
| Number of available languages | 28 languages | 28 languages | 28 languages | 29 languages | 29 languages |
| Number of dialogues between top management and employees | About 4,000 times | About 4,500 times | About 4,600 times | About 4,600 times | About 4,500 times |
Numbers of facilities/Sales revenue
| FY2020 | FY2021 | FY2022 | FY2023 | FY2024 | ||
|---|---|---|---|---|---|---|
| Manufacturing facilities and sales facilities | In more than 40 countries and regions | |||||
| Sales revenue (Consolidated) | 631,812 million yen | 710,938 million yen | 815,269 million yen | 822,930 million yen | 876,558 million yen | |
| Sales revenue by region | Japan | 15.7% | 14.8% | 14.2% | 14.2% | 13.3% |
| The Americas | 31.8% | 31.3% | 33.8% | 34.4% | 34.6% | |
| Europe | 28.2% | 27.3% | 25.7% | 27.7% | 27.0% | |
| Asia & Others | 24.3% | 26.6% | 26.3% | 23.8% | 25.1% | |
Evaluation by external entities
| FTSE4Good Index Series | Included since June 2020 |
|---|---|
| FTSE Blossom Japan Index | Included since June 2020 |
| FTSE Blossom Japan Sector Relative Index | Included since March 2022 |
| MSCI Nihonkabu ESG Select Leaders Index | Included since June 2023 |
| MSCI Japan Empowering Women (WIN) Select Index | Included since November 2019 |
| Morningstar Japan ex-REIT Gender Diversity Tilt Index | Included since 2022 |
| S&P/JPX Carbon Efficient Index | Included since 2018 |
| The SOMPO Sustainability Index | Included since 2012 |
| EcoVadis Sustainability Assessment | Received a Silver Medal since 2020 and a Bronze Medal in 2025 |
| Science Based Targets | Certified for 1.5°C target in April 2022 |
| CDP 2024 Supplier Engagement Rating | Recognized as a Supplier Engagement Leader for FY2024 |
| "Asia-Pacific Climate Leaders" Survey | Selected as one of the top companies since 2022 |
| Clarivate Top 100 Global Innovators | 1x Winner in 2012 and 6x Winner in 2023 |
| Energy Conservation Grand Prize | Awarded for the first time in FY2021 and three times in total in FY2023 and FY2024 |
| Health & Productivity Stock Selection Program | Recognized in 2017, 2019, 2020, 2021 and 2024 |
| Certified Health & Productivity Management Outstanding Organization | Certified since 2017 |
Environmental-Related Data (E)
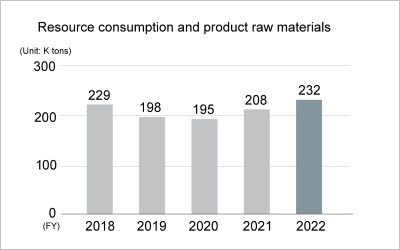
Material balance
The Brother Group's manufacturing facilities are engaged in processing and assembly to manufacture products.
The environmental impacts (including resource consumption, CO2 emissions, and waste generated) associated with all business operations are quantitatively monitored and summarized to reduce environmental impacts.
Resource utilization and material production/emissions from FY2020 through FY2024
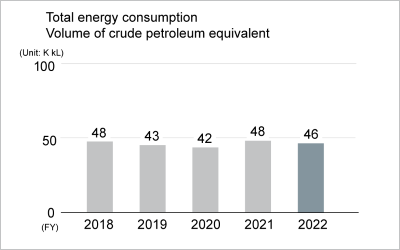
Resource and energy inputs
Material production/emissions
For the list of applicable sites, see page 8 of "Material balance" [PDF/239KB].
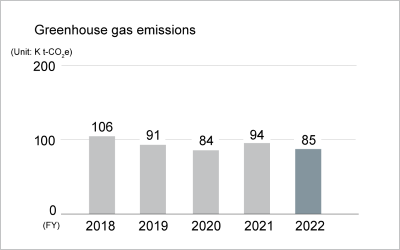
Reduction of CO2 emissions
Scope 1, 2, and 3 greenhouse gas (GHG) emissions according to ISO 14064 from FY2020 through FY2024
| Category | CO2 emissions in t-CO2e equivalent | |||||
|---|---|---|---|---|---|---|
| FY2020 | FY2021 | FY2022 | FY2023 | FY2024 | ||
| Scope 1: Direct emissions | 18,356 | 18,724 | 19,040 | 18,840 | 17,850 | |
| Scope 2: Indirect emissions from energy use Market-based | 98,685 | 105,099 | 93,409*1 | 91,228*1 | 82,897*1 | |
| Scope 3: Other indirect emissions | 2,752,567 | 2,942,352 | 3,439,056*2 | 2,431,462*1 | 2,633,871*1 | |
| C1 | Purchased goods and services | 1,302,661 | 1,404,939 | 1,671,015*2 | 1,253,780*1 | 1,411,041*1 |
| C2 | Capital goods | 75,897 | 86,955 | 123,562 | 126,268 | 119,606 |
| C3 | Fuel- and energy-related activities | 10,987 | 11,838 | 12,062 | 11,899 | 12,130 |
| C4 | Upstream transportation and distribution | 103,148 | 138,978 | 99,236 | 95,109 | 90,402 |
| C5 | Waste generated in operations | 4,138 | 2,849 | 3,257 | 3,991 | 8,822 |
| C6 | Business travel | 1,558 | 1,887 | 4,023 | 6,502 | 6,673 |
| C7 | Employee commuting | 14,698 | 14,819 | 14,768 | 15,553 | 16,574 |
| C8 | Upstream leased assets | 4,642 | 4,101 | 3,827 | 4,588 | 4,316 |
| C9 | Downstream transportation and distribution | 14,671 | 15,366 | 17,825 | 14,762 | 14,269 |
| C10 | Processing of sold products | - | - | - | - | - |
| C11 | Use of sold products | 968,174 | 995,115 | 1,183,284 | 670,148 | 642,375 |
| C12 | End of life treatment of sold products | 250,107 | 263,618 | 305,036 | 227,291 | 306,135 |
| C13 | Downstream leased assets | 1,886 | 1,886 | 1,160 | 1,168 | 1,178 |
| C14 | Franchises | - | - | - | - | - |
| C15 | Investments | - | - | - | 402*3 | 350*3 |
| Total of Scopes 1, 2, and 3 Market-based |
2,869,608 | 3,066,176 | 3,551,505*1,2 | 2,541,530*1 | 2,734,618*1 | |
- After using renewable energy electricity certificates from external sources
- The numerical value has been changed because the CO2 emissions from purchased goods and services other than products and parts were added to C1 (Purchased goods and services). However, the additional CO2 emissions in FY2022 (about 2% of the entire Scope 3) are not included in the auditing for ISO 14064.
- Emissions from related companies have been added since FY2023.
Scope
External assurance
-
BSI Independent Assurance Statement 2024 [PDF/823KB]
-
-
-
-
-
- In 2024, questions regarding Climate change, Forests, Water security, Plastics, and Biodiversity were integrated into the CDP Questionnaire.
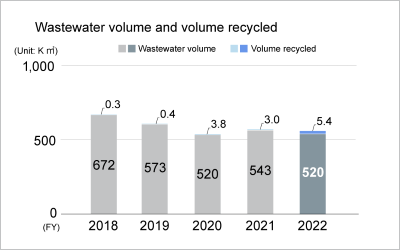
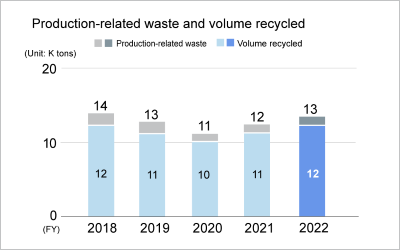
Resource circulation and waste reduction
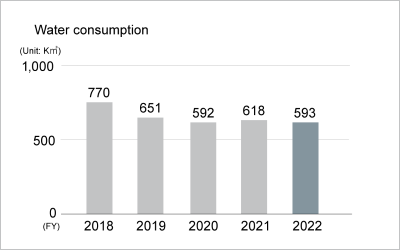
Water-related data at main business sites from FY2020 through FY2024
Water intake, wastewater volume, volume of water recycled
| FY2020 | FY2021 | FY2022 | FY2023 | FY2024 | ||
|---|---|---|---|---|---|---|
| Water intake(m3) | Clean water | 504,122 | 506,166 | 470,172 | 408,991 | 446,818 |
| Industrial water | 0 | 0 | 0 | 0 | 0 | |
| Underground water | 87,474 | 111,697 | 123,034 | 119,904 | 151,316 | |
| Wastewater volume(m3) | Public waters | 179,782 | 170,392 | 150,453 | 110,928 | 126,247 |
| Sewer system | 338,746 | 372,721 | 369,193 | 333,406 | 375,282 | |
| Others | 1,177 | 150 | 149 | 36 | 0 | |
| Volume of water recycled(m3) | 3,759 | 2,978 | 5,385 | 8,717 | 16,354 | |
| Percent of water recycled(%) | 0.7 | 0.5 | 1.0 | 1.9 | 3.2 | |
For the list of applicable sites, see page 5 of "Material balance" [PDF/239KB].
Water pollution load
| FY2020 | FY2021 | FY2022 | FY2023 | FY2024 | ||
|---|---|---|---|---|---|---|
| Water pollution load(t) | BOD | 37.8 | 29.3 | 31.2 | 19.5 | 21.3 |
| COD | 95.3 | 68.4 | 48.1 | 36.8 | 48.0 | |
| N-hexane extracts | 0.7 | 0.5 | 1.5 | 0.5 | 0.6 | |
| SS | 29.4 | 12.0 | 15.6 | 6.6 | 7.9 | |
For the list of applicable sites, see page 8 of "Material balance" [PDF/239KB]
- In 2024, questions regarding Climate change, Forests, Water security, Plastics, and Biodiversity were integrated into the CDP Questionnaire.
Biodiversity conservation
-
-
-
-
- Taskforce on Nature-related Financial Disclosures (TNFD)
- Biodiversity Conservation
-
A webpage that introduces the cooperative projects recognized by UNDB-J
(Link to the website of UNDB-J. This website is available only in Japanese.)
Pollution prevention and chemical substance management
Creating eco-conscious products
Social-Related Data (S)
Product safety
| Basic Product Safety Policies | Established in 2008 |
|---|
Business partners
| FY2020 | FY2021 | FY2022 | FY2023 | FY2024 | |
|---|---|---|---|---|---|
| Procurement Policy and CSR Procurement Standards | Established in 2008 | ||||
| Green Procurement | Started in 2001 | ||||
| Supplier meeting | Conducted online Participated in by 217 people from 129 companies | Conducted online Participated in by 680 people from 380 companies | Conducted online Participated in by 814 people from 478 companies | Conducted on-site and online Participated in by 842 people from 472 companies | Conducted on-site and online Participated in by 734 people from 408 companies |
| CSR questionnaire | Started in 2012 (conducted every three years), revised in 2020 (conducted every two years) | ||||
Diversity/Supporting work-life balance*1
| FY2020 | FY2021 | FY2022 | FY2023 | FY2024 | ||
|---|---|---|---|---|---|---|
| Number of employees*2 | All employees | 3,803 | 3,867 | 3,890 | 3,877 | 3,903 |
| Male | 3,024 | 3,067 | 3,084 | 3,071 | 3,077 | |
| Female | 779 | 800 | 806 | 806 | 826 | |
| Percentage of female employees in total workforce | 20.5% | 20.7% | 20.7% | 20.8% | 21.2% | |
| Average length of service*2,3 | All employees | 17.3 | 17.1 | 16.7 | 16.3 | 16.1 |
| Male | 17.2 | 16.9 | 16.4 | 16.1 | 16.0 | |
| Female | 17.7 | 17.9 | 17.5 | 17.2 | 16.6 | |
| Gender gap | 102.9% | 105.9% | 106.7% | 107.2% | 103.7% | |
| Total number of employees in senior management *2,4,5 |
All employees | 842 | 815 | 777 | 756 | 760 |
| Male | 804 | 772 | 731 | 708 | 708 | |
| Female | 38 | 43 | 46 | 48 | 52 | |
| Percentage of female employees in senior management | 4.5% | 5.3% | 5.9% | 6.3% | 6.8% | |
| ① Total number of new graduates*3,6 | All employees | 81 | 74 | 84 | 113 | 95 |
| Male | 66 | 57 | 65 | 84 | 68 | |
| Female | 15 | 17 | 19 | 29 | 27 | |
| Percentage of female new graduates | 18.5% | 23.0% | 22.6% | 25.7% | 28.4% | |
| ② Total number of mid-career recruits*3,7,8 | All employees | 21 | 24 | 71 | 46 | 65 |
| Percentage of mid-career recruits based on Labor Measures Comprehensive Promotion Act | 21% | 24% | 46% | 29% | 41% | |
| Male | 16 | 20 | 56 | 38 | 49 | |
| Female | 5 | 4 | 15 | 8 | 16 | |
| Percentage of female mid-career recruits | 23.8% | 16.7% | 21.1% | 17.4% | 24.6% | |
| Total number of newly hired employees (① and ② combined) |
All employees | 102 | 98 | 155 | 159 | 160 |
| Male | 82 | 77 | 121 | 122 | 117 | |
| Female | 20 | 21 | 34 | 37 | 43 | |
| Percentage of female employees | 19.6% | 21.4% | 21.9% | 23.3% | 26.9% | |
| Percentage of contract employees (including temporary staffs) | 17.2% | 21.1% | 23.1% | 23.1% | 23.9% | |
| Voluntary turnover rates / Number of employees leaving*3,9 | 1.0% / 39 | 0.94% / 36 | 1.44% / 55 | 1.42% / 54 | 1.59% / 60 | |
| Employment rate of persons with disabilities*10,11 | Brother Industries, Ltd. | 2.17% | 2.29% | 2.38% | 2.34% | 2.44% |
| including 13 Brother Group companies in Japan*12 | 2.17% | 2.26% | 2.31% | 2.31% | 2.38% | |
| Number of employees on childcare leave*13,14 | All employees | 96 | 94 | 92 | 119 | 111 |
| Male | 60 | 65 | 63 | 77 | 86 | |
| Female | 36 | 29 | 29 | 42 | 25 | |
| Percentage of employees on childcare leave | Male | 49.2% | 52.0% | 67.0% | 70.0% | 79.6% |
| Female | 100.0% | 100.0% | 100.0% | 100.0% | 96.2% | |
| Number of employees on family-care leave*13 | All employees | 2 | 2 | 2 | 2 | 5 |
| Male | 1 | 2 | 1 | 0 | 2 | |
| Female | 1 | 0 | 1 | 2 | 3 | |
| Number of employees using the short-time working system for childcare | All employees | 184 | 184 | 175 | 164 | 165 |
| Male | 10 | 8 | 9 | 9 | 8 | |
| Female | 174 | 176 | 166 | 155 | 157 | |
| Number of employees using the short-time working system for family-care | All employees | 5 | 5 | 4 | 4 | 2 |
| Male | 2 | 1 | 1 | 2 | 0 | |
| Female | 3 | 4 | 3 | 2 | 2 | |
| Number of employees on nursing care leave | All employees | 13 | 16 | 32 | 35 | 27 |
| Male | 3 | 6 | 12 | 14 | 12 | |
| Female | 10 | 10 | 20 | 21 | 15 | |
- Brother Industries, Ltd.
- As of March 31 of each FY
- Doesn't include incoming seconded employees, temporary employees or fixed-term employees
- Includes temporary employees and seconded employees. Doesn't include Directors, Corporate Auditors, and Executive Officers
- Recalculated and updated based on the standards of *4
- Revised from the number of employees who joined on April 1 of each fiscal year to the number of employees who joined on April 1 and October 1 of each fiscal year
- Number of employees who joined each fiscal year between April 1 and March 31 of the following year
- Includes conversions from non-regular employment to regular employment and transfers. Doesn't include re-employed individuals
- Employees who resigned for personal reasons
- As of June 1 of each FY
- Includes incoming seconded employees but not temporary employees or fixed-term employees
- BROTHER INTERNATIONAL CORPORATION, BROTHER SALES, LTD., BROTHER ENTERPRISE, LTD., BROTHER LOGITEC LTD., XING INC., STANDARD CORP., TEICHIKU ENTERTAINMENT, INC., NISSEI CORPORATION, MIE BROTHER PRECISION INDUSTRIES, LTD., BROTHER REAL ESTATE, LTD., BROTHER LIVING SERVICE CO., LTD., BETOP STAFF, LTD., BROTHER INDUSTRIAL PRINTING (JAPAN), LTD.
- Number of employees who took leave in the respective year
- The figures for the number of employees on childcare leave and the percentage of employees on childcare leave have been recalculated and updated based on the standards set by the Ministry of Health, Labour and Welfare.
Safety, health and disaster prevention/Health and productivity management
| FY2020 | FY2021 | FY2022 | FY2023 | FY2024 | |
|---|---|---|---|---|---|
| Number of occupational injuries reported at manufacturing facilities | 18 | 15 | 18 | 14 | 8 |
| Yearly incident rate ((number of incidents/number of employees) x 1,000) at manufacturing facilities | 0.66 | 0.50 | 0.62 | 0.58 | 0.30 |
| Brother Safety and Prevention Convention | Held every year since 2008 | ||||
| The Brother Group Health & Productivity Management Philosophy | Established in 2016 | ||||
Local communities
| FY2020 | FY2021 | FY2022 | FY2023 | FY2024 | ||
|---|---|---|---|---|---|---|
| Employees' participation in the Golden Ring Project | Suspended | At 13 facilities | At 24 facilities | At 30 facilities | At 29 facilities | |
| Amount of global donations | 94,467,274 yen | 225,495,501 yen | 188,320,870 yen | 229,866,510 yen | 176,114,373 yen | |
| The Kizuna Fund | Number of employees who participated | 97 | 129 | 105 | 112 | 52 |
| Amount of donations | 1,524,950 yen | 2,570,965 yen | 4,211,876 yen | 3,696,388 yen | 3,424,522 yen | |
| Amount of donations to registered not-for-profit organizations (Brother Industries, Ltd.) | 3,472,020 yen | 65,014,680 yen | 44,307,800 yen | 42,831,730 yen | 23,448,760 yen | |
| Tokai Young Entrepreneur Seminar | Supported by Brother Industries, Ltd. since 2008 | |||||
| Number of pro bono participants (Brother Industries, Ltd.) | Target | 3 | 3 | 3 | 3 | 4 |
| Achievement | 3 | 3 | 4 | 4 | 4 | |
Governance-Related Data (G)
Corporate governance
| FY2020*1 | FY2021*2 | FY2022*3 | FY2023*4 | FY2024*5 | ||
|---|---|---|---|---|---|---|
| Number of Directors | Total | 11 | 11 | 11 | 11 | 10 |
| Outside Directors (included in total) | 5 | 5 | 5 | 5 | 5 | |
| Percentage/Number of female Directors on the Board | Percentage | 9.1% | 9.1% | 9.1% | 9.1% | 10.0% |
| Number | 1 | 1 | 1 | 1 | 1 | |
| Number of Statutory Auditors | Total | 5 | 5 | 5 | 5 | 5 |
| Outside Auditors (included in total) | 3 | 3 | 3 | 3 | 3 | |
| Number of Directors, Statutory Auditors and Executive Officers | Total | 31 | 30 | 30 | 32 | 33 |
| Female Officers (included in total) | 2 | 2 | 3 | 3 | 4 | |
| Non-Japanese Officers (included in total) | 2 | 2 | 2 | 2 | 2 | |
| The Brother Group Principles of Social Responsibility | Established in 2012 | |||||
| Global internal audit meeting | Started in 2010 | |||||
| Group Information Management Regulation | Established in 2015 (The information management regulation of Brother Industries, Ltd. was established in 2005.) | |||||
- As of June 23, 2021
- As of June 20, 2022
- As of June 22, 2023
- As of June 25, 2024
- As of June 25, 2025